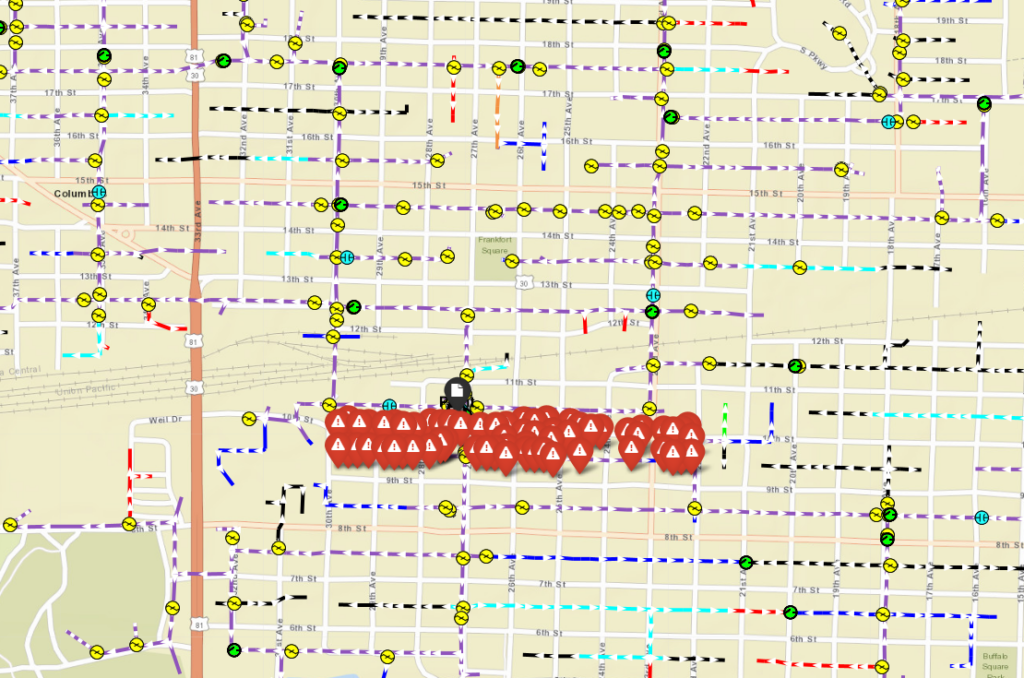
An example of an outage on Loup’s new Outage Mapping System. Customers can view a pared-down version that shows a radius around an outage.
Years ago, Loup Power District’s line technicians carried large books of distribution line maps in their trucks.
They noted upgrades, repairs, and changes on those maps as they went about their work and then transferred those notes to large wall maps in each division’s home office. Those wall maps were periodically removed, updated by computer drafters, and rehung.
The system was tedious and somewhat inefficient, but that’s how it was done before the technological advances that brought about online infrastructure maps, smart meters, and real-time notes.
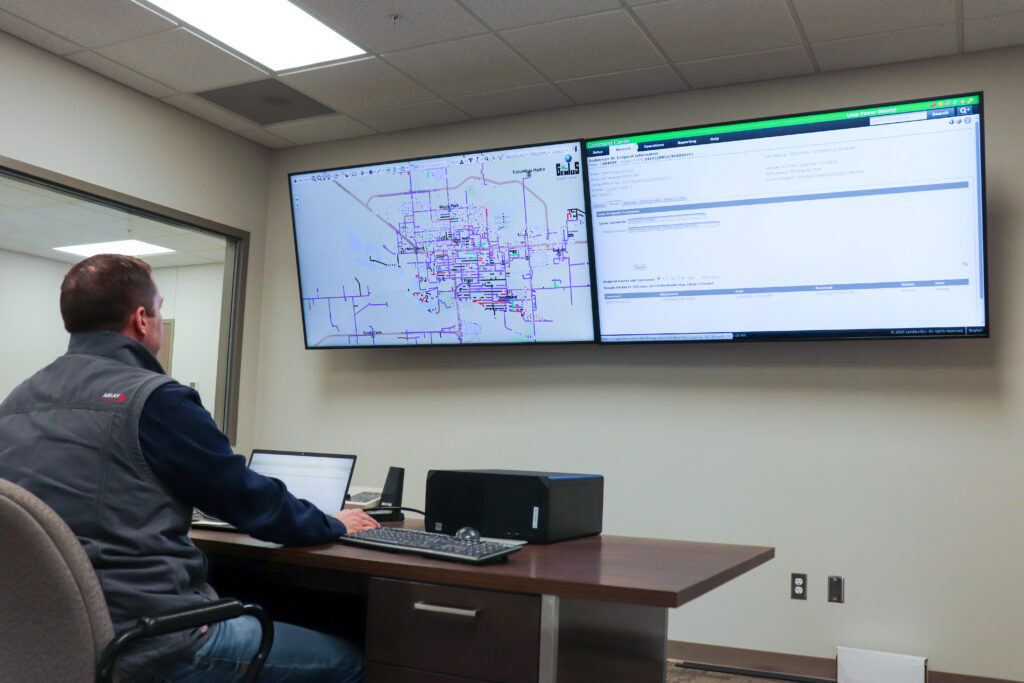
Today, Loup’s employees are able to view online maps with a plethora of information about infrastructure and assets. They can view notes made by coworkers and see which customers are out of power at any given time.
“This has changed the way we operate,” said Meter Maintenance Superintendent Tim Ramaekers.
FIRST STEP: AMI METERS

Meter Maintenance Superintendent Tim Ramaekers views District electrical maps.
Back in 2018, Loup installed 227 Gridstream energy meters in Columbus as part of a pilot project. The meters relayed outage notifications within seconds. They also successfully noted when power was restored.
With that success, Loup began a five-year plan to install 21,000 meters throughout its service territory.
“Before this technology, we had to rely on customers to call us and tell us when their power was out,” Ramaekers said.
That meant that big outages sometimes resulted in confusion. Line techs were dispatched to different locations to try and diagnose problems. Some customers didn’t report outages right away and were overlooked.
“Our response times are so much faster now because we can go directly to the problem,” Ramaekers said.
NEXT: A FULL-SERVICE SYSTEM

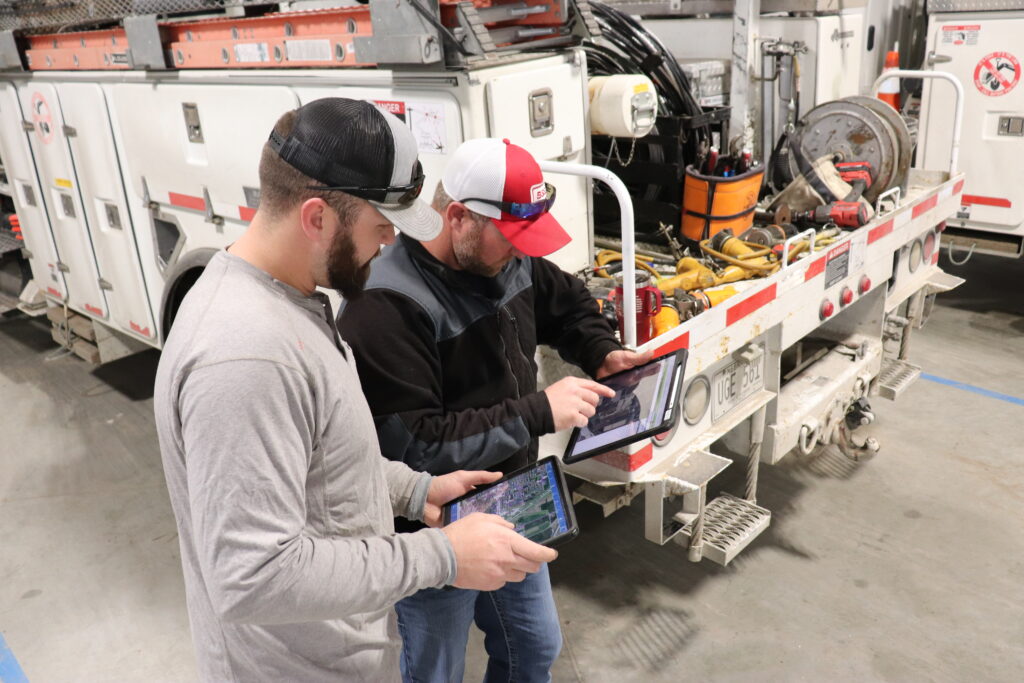
Journey Line Technician Tommy Wemhoff and Line Technician Beau Schommer reference the Outage Mapping System while discussing a project.
The system worked as it should following the successful installation of all the smart meters. They correctly noted outage locations and customer information. Still, the system had limitations. So employees in the Meter Maintenance and Engineering Departments joined forces with RVW a local engineering firm located in Columbus.
Together, they developed a full-featured outage map that relays outage information in addition to Loup assets, equipment, maps, and notes.
“This is an amazing asset to our employees,” said Korey Hobza, Vice President of Engineering. “It will put all of our information at their fingertips when they need it.”
The interactive one-line diagram maps of Loup’s distribution system offer a broad look at real-time energy operations as well as detailed notes and equipment descriptions.
Operations personnel can log in to the system from tablets equipped with cell service. This means they can get all the information they might need about a project at any given time.
They can zoom in on a meter to learn the transformer and meter number, service address, and meter type and voltage. They can overlay a Google map, click and outage icon, and simply click “Navigate” to get directions.
Overlaying a topology map will inform them about terrain so they have proper equipment and a radar map overlay lets employees know that that severe weather and lightning are on the way.
CUSTOMER BENEFITS

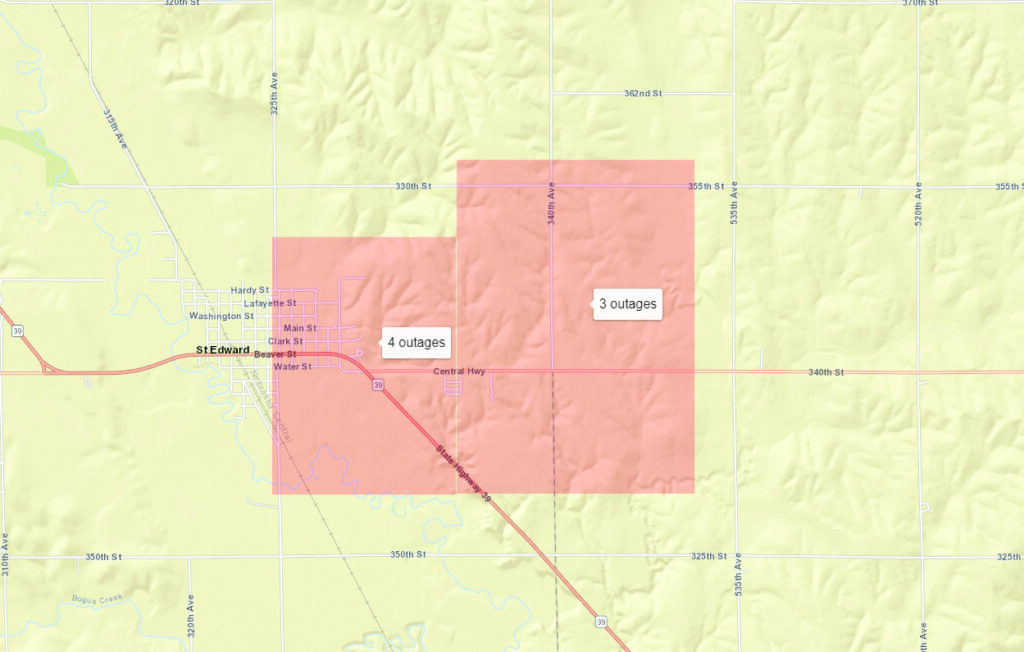
Customer version of the outage map:
Any outages will be noted with a colored box. The expanded radius means customers won’t have to worry about the public knowing exactly who is out of power.
Loup customers have access to a pared-down version of this map, accessible at loup.com.
Customers can still call their local office to report an outage. But they also have the additional option of checking in on outages online.
The map lets customers know that Loup is aware of outages by displaying the general location and number of outages. This expanded radius means customers won’t have to worry about the public knowing exactly who is out of power. Customers can report their specific outage via a link on the map if desired.
Engineering Tech Aric Alt and Drafting Technician Clint Albracht helped create the map information by noting GPS locations and technical information. With that done, it’s just a matter of maintaining that information.
This used to be done by referring to red marks on a wall map. Today, the line techs send details over to the Engineering Department so those changes can be made electronically and updated by the next day.
Alt said this means faster response times for customers in the event of an unplanned outage.
Before, he said, employees might have to go to an outage location to learn about breakers, switches, transformers, or fuses. Then, they’d have to go back to the service center to gather the proper equipment, and make their way back for repair. Now, they can access all that information from the get-go.
Read more stories about Loup Power District.

